Power BI Project Management
Manage your projects more effectively with accurate business intelligence in real-time
Power BI project management information at your fingertips. Get real-time project business intelligence with Adeaca PBA.
Power BI Reporting and Visualization in a Generation 3 Project Business System
Power BI Reporting and Visualization in Adeaca PBA provides unique capabilities that go beyond other solutions on the market.
Generation 1 and 2 systems today do not integrate their project financials and operations, and as a result, companies must manage multiple engagements while manually trying to integrate critical project data.
Due to the true integration of a generation 3 system, Power BI Visualization in Adeaca PBA enables project-driven companies to visualize project KPIs within a single solution, providing holistic project intelligence in real time.
Customize How You Want to See the Project Data
When the most important objective is the successful and profitable delivery of projects, it’s critical to be able to closely manage a wide range of project KPIs and demands a high degree of visibility into the status of your projects.
- Access flexible real-time project and portfolio analytics
- Create and visualize project KPIs across both financial and operational areas
- Easily identify potential problem areas at enterprise or portfolio level and identify the root cause
Visualize Data Across a Broad Array of Project Metrics and KPIs
Get real-time insight into the health of your projects, portfolios, and business overall.
Customize and visualize how you want to see the data immediately without having to spend time and resources trying to manually collect data from different solutions. With Power BI in Adeaca PBA, you can instantly create unique reports based on your business needs.
Manage
Adeaca PBA allows you to report on all aspects of your projects through Microsoft Power BI./p>
Track and Identify
Track critical KPIs in real-time and identify performance trends. Benchmark your performance against company goals and industry standards.
Report
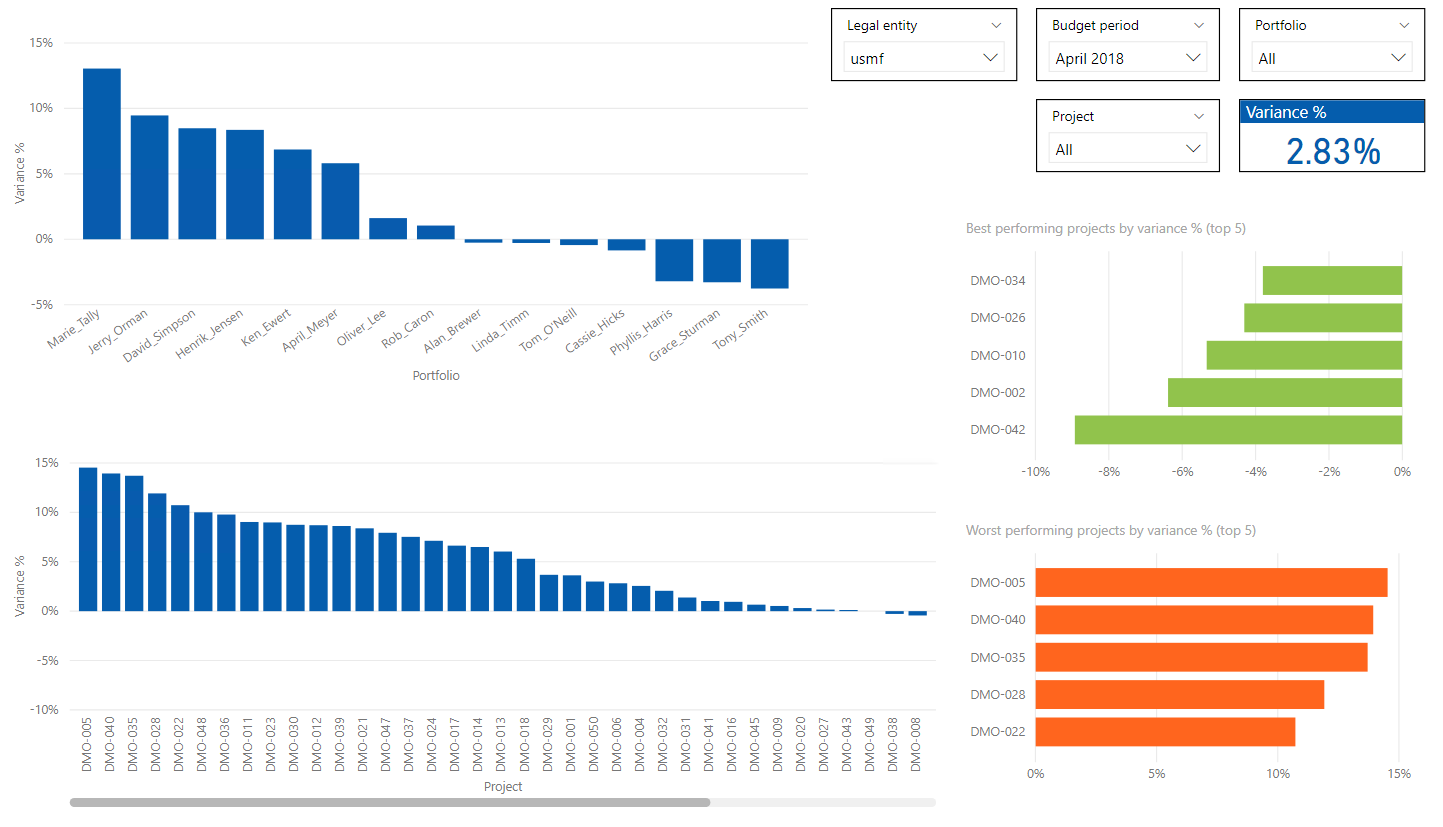
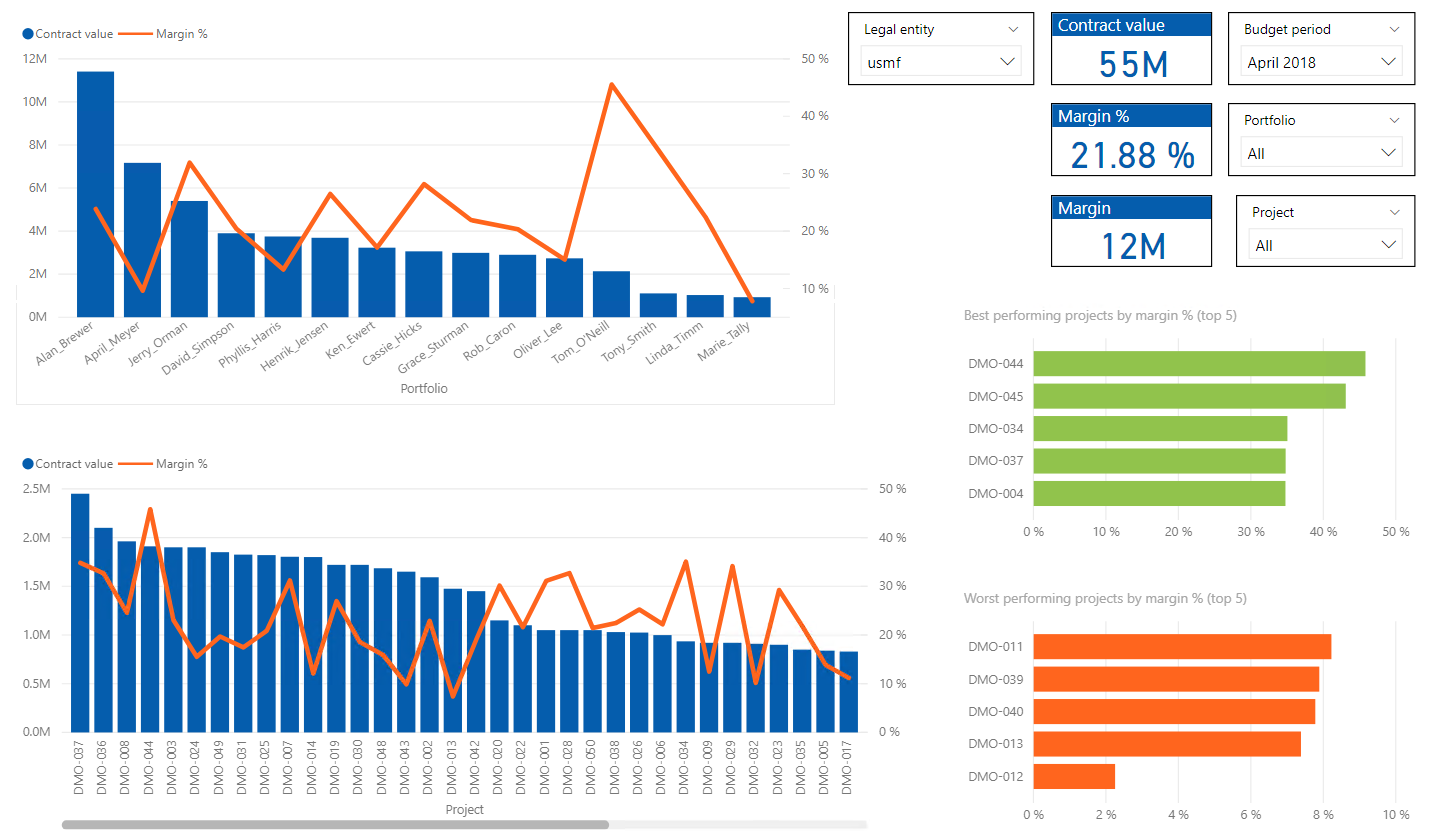
Project BI in Adeaca PBA allows you to customize and visualize an overview of project and portfolio performance including graphical representations of core metrics.
How Power BI Reporting and Visualization in Adeaca PBA Works
Flexible and customizable visualization of project data
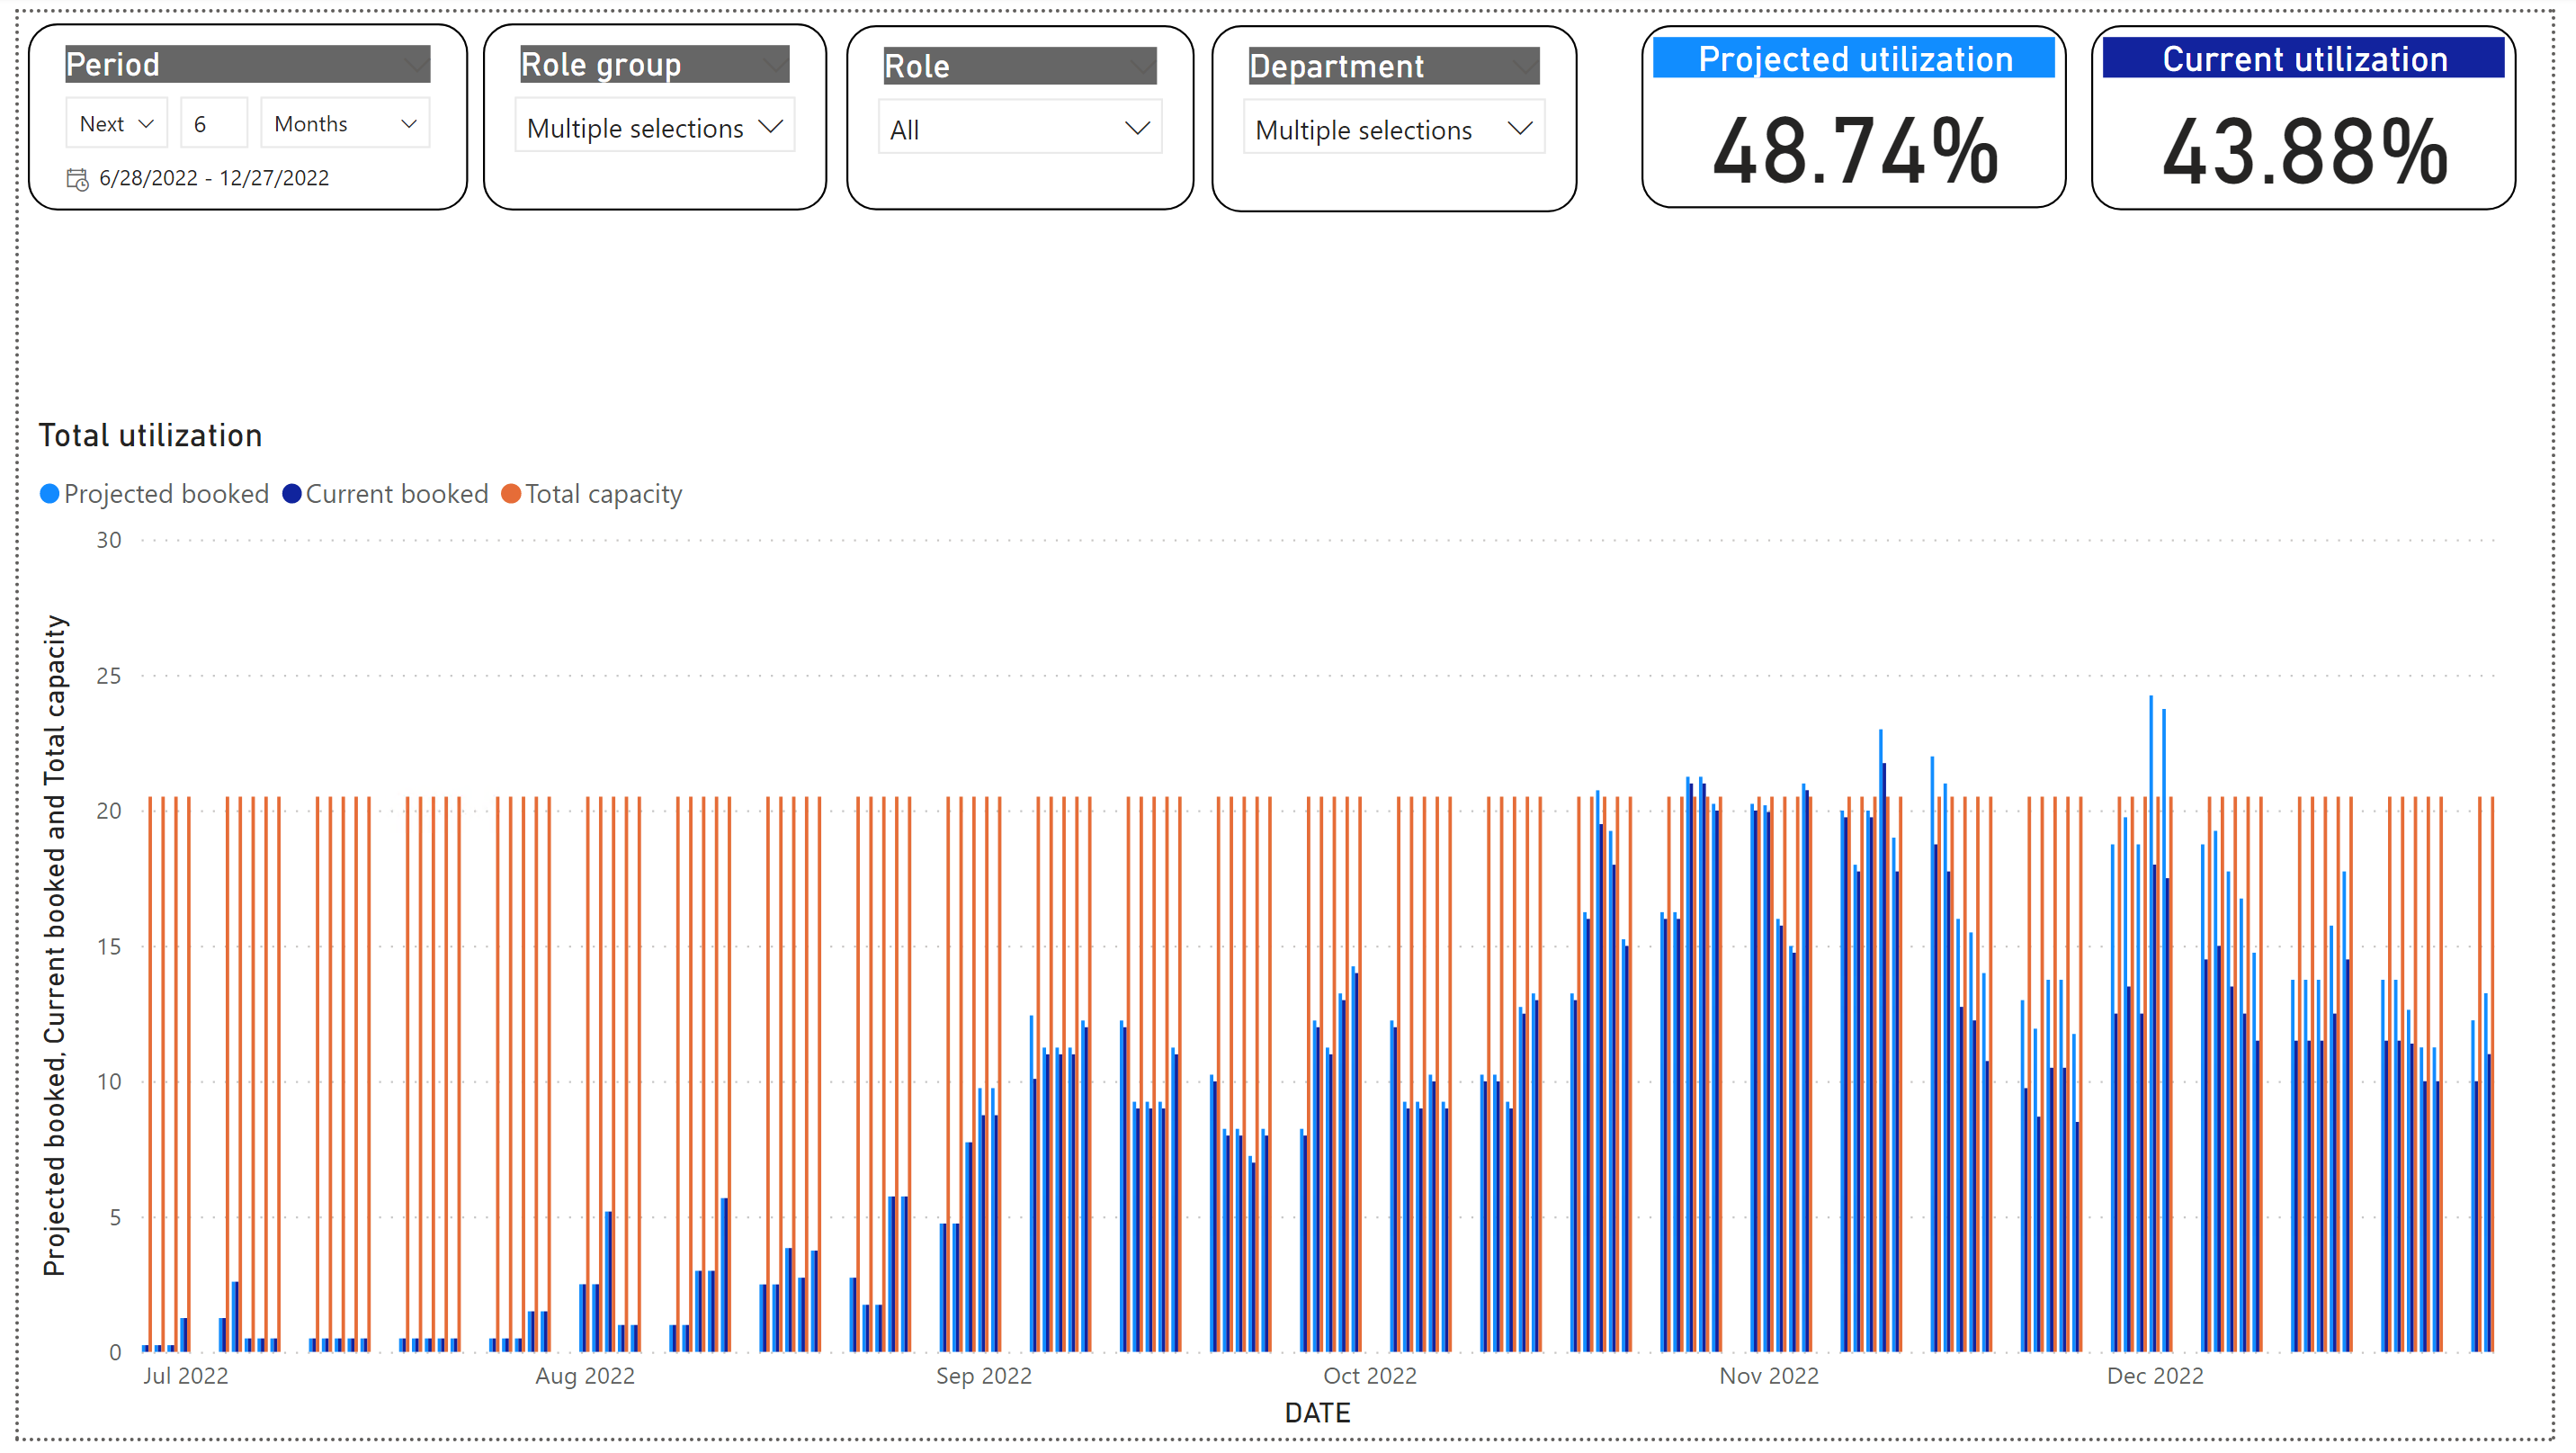
Power BI in Adeaca PBA allows you to visualize resource utilization in a project based on role names and groups. Project leaders can customize how they want resource utilization data represented based on different fields, visualizations, and filters. Without having to manually import data from different point solutions, Adeaca PBA immediately pulls data from project financials and operations to generate a report that can show projected utilization and current utilization.
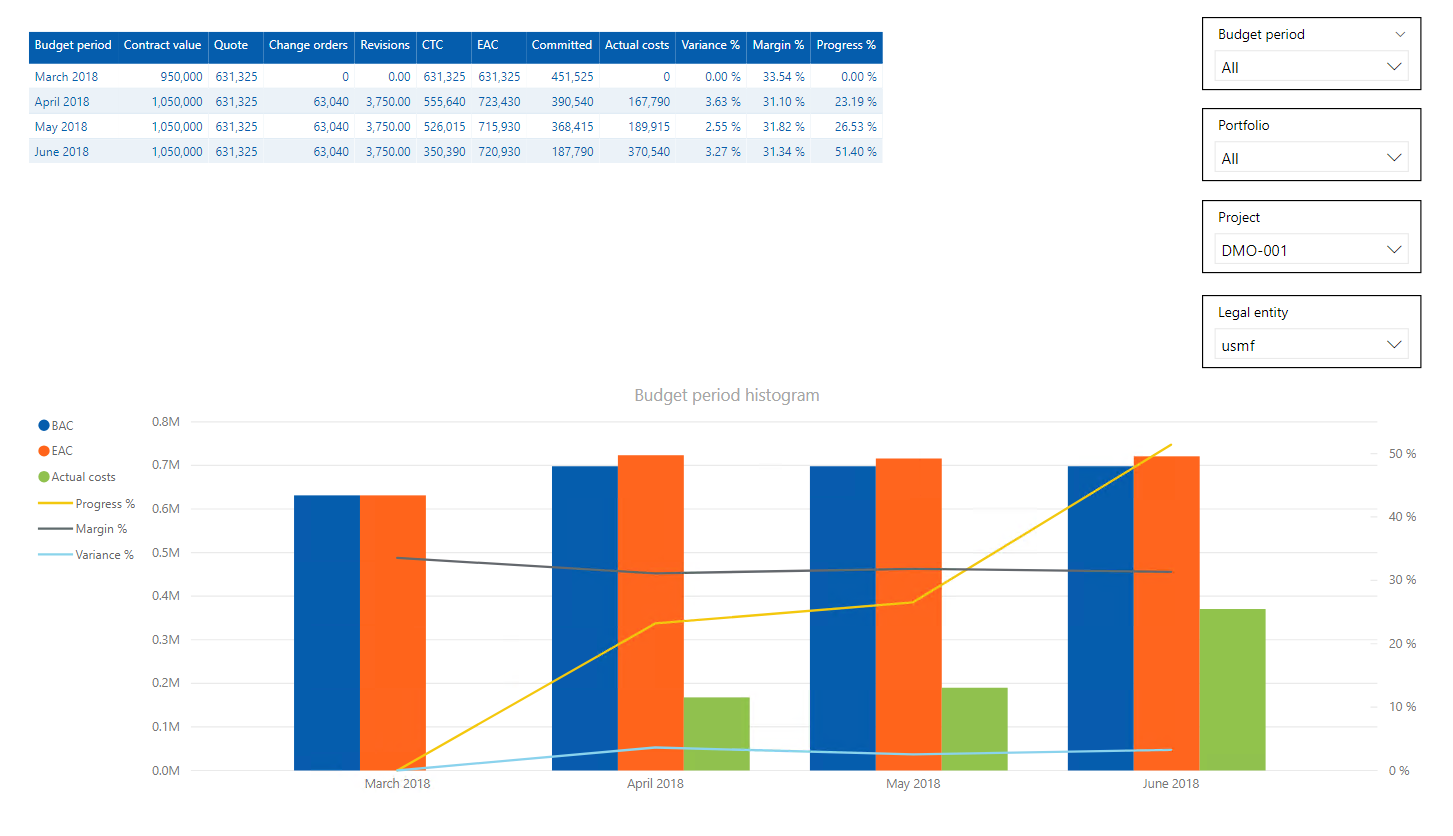
Financial breakdown of projects
While project financials including budget, actuals, committed costs, accrued revenue, EAC, etc. can be viewed in Adeaca PBA’s cost breakdown structure, in Power BI, you can view the project subtotals by manager and client. The costing sheet in Adeaca PBA is project specific, but there’s a certain visual inside PBA that gives you a summary by portfolio. Power BI in Adeaca PBA presents different ways of seeing the same data.
Enhanced project dashboards with Power BI
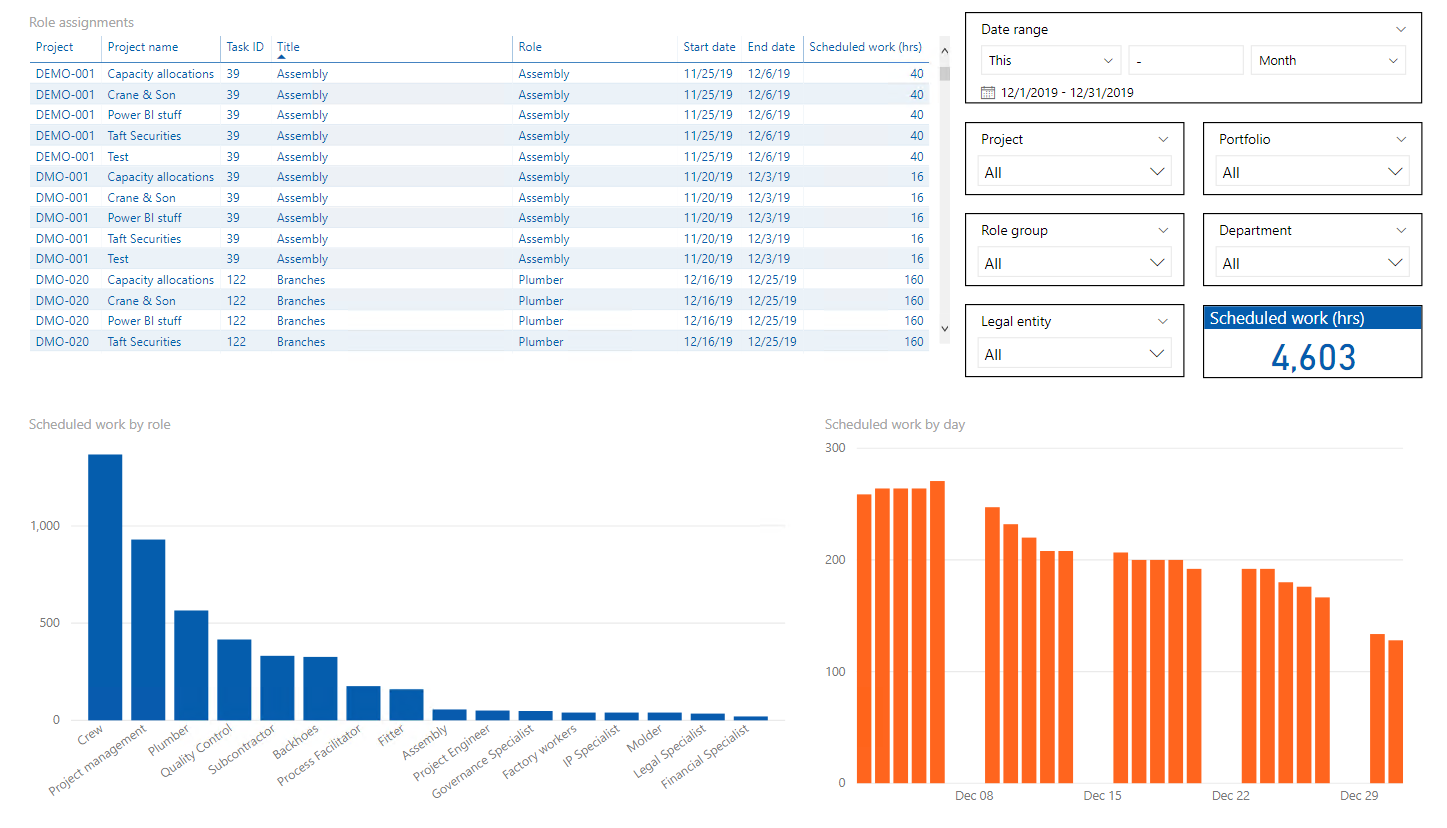
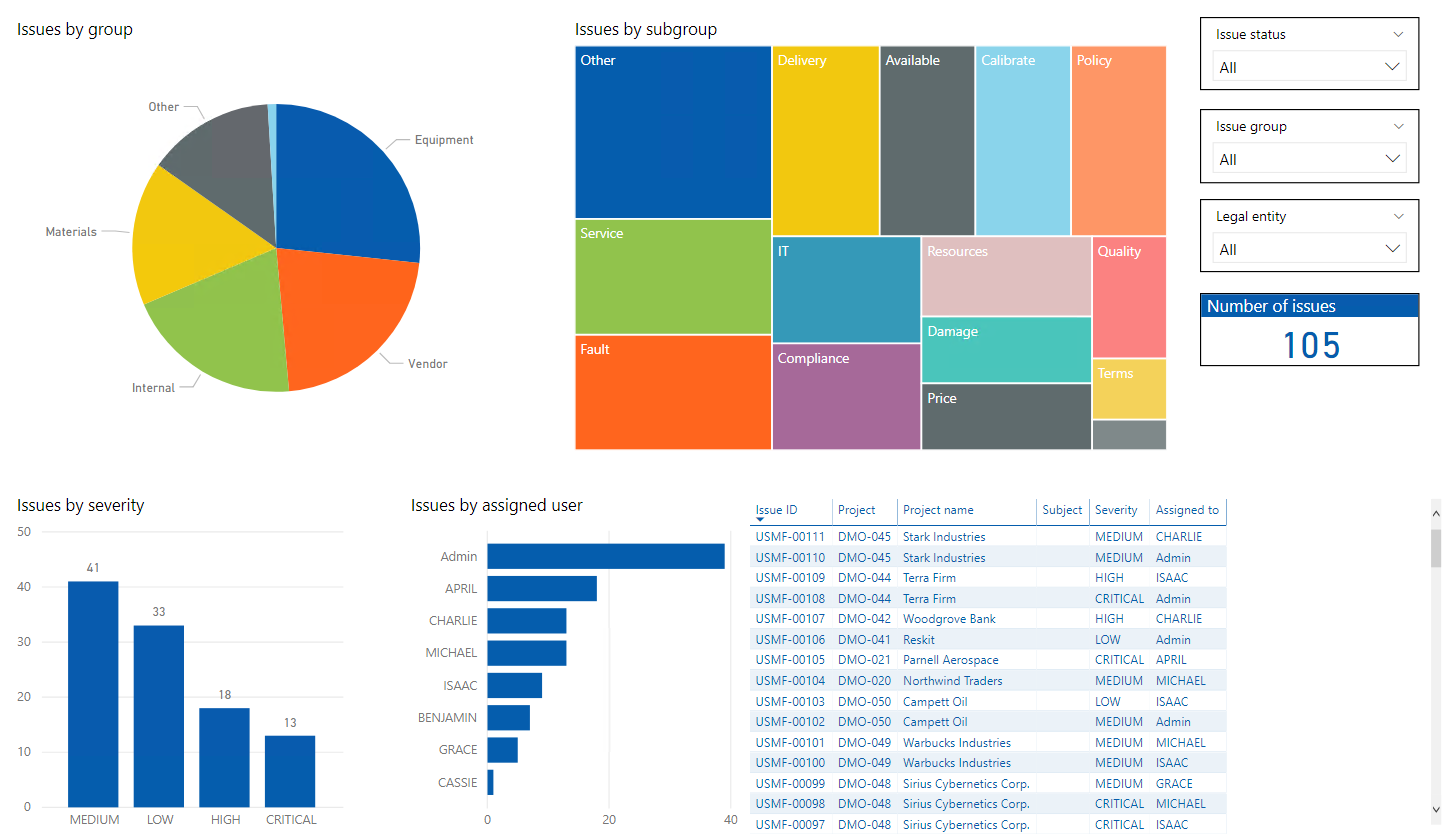
Adeaca utilizes Microsoft Power BI to give you access to flexible real-time project and portfolio analytics. Here are just a few examples.
Power BI is a part of how project insight is visualized with Adeaca PBA. To learn more about our project insight and Adeaca PBA, take our PBA Fit Assessment. You will learn if PBA is a fit for your and how the insight it provides can bring value to your organization.
How Power BI Reporting and Visualization in Adeaca PBA brings value to your organization
Better Cost Control
Power BI Reporting and Visualization in Adeaca PBA allows you to create and generate project reports instantly by pulling real-time project data from project financials and operations within PBA. Power BI allows you to customize and visualize how you want to see the data immediately without having to spend time and resources trying to manually collect data from different solutions.
Enhanced Risk Readiness
Adeaca PBA allows you to manage project risks in real time. By doing all the data mining for you, Adeaca PBA ensures warning signs are flagged immediately and well before they have any significant impact on project performance.
Improved Delivery
Power BI in Adeaca PBA allows you to instantly see performance trends and benchmark your performance against company goals. Since there is no data translation or time-lapse between source transactions and visualization, all project intelligence is available in real time, allowing you to make better decisions based on accurate data, resulting in the successful delivery of your projects.
Download the Feature Brief: Project Insight with Power BI Reporting and Visualization in Adeaca PBA
Download the Project Insight with Power BI Reporting and Visualization Feature Brief to learn more and discover what it can do for your company.
What you will learn:
- What is Power BI Reporting and Visualization in Adeaca PBA and its purpose
- How does it work
- Problems Power BI Reporting and Visualization in Adeaca PBA solves
- Use cases for Power BI Reporting and Visualization in Adeaca PBA
- How Power BI Reporting and Visualization in Adeaca PBA will benefit your company
If you’re looking to create customizable visualizations for your unique project insight requirements, you need this brief.
Find answers to your questions
Discover more or engage with our project business experts.
Transform with PBA
Download our exclusive eBook: Project Business Transformation with PBA to uncover the strategies you need to revolutionize project business management in your organization.
PBA Fit Assessment
Quickly find out if Project Business Automation will work for your company. Based on your company's profile, we will share how your transformation with Adeaca will solve your problems and bring value to your business.
Send a Message
Simply start an email dialogue to gather some more information about how we work and the transformation we may be able to bring to your organization.


